Report on the 2022/24 Monitoring Period
Se está à procura da versão portuguesa deste relatório consulte: Relatório de Monitorização do Período 2022/24: análise aos requisitos de acessibilidade dos sítios Web e das aplicações móveis parte do DL n.º 83/2018.
Report in HTML format
AMA, I.P. & FCUL. (December 2022). Report on the 2022/24 Monitoring Period: analysis of accessibility requirements for websites and mobile applications part of DL 83/2018.. Lisbon: Unit of Digital Accessibility of the Administrative Modernisation Agency, Public Institute, and LASIGE, Computer Science and Engineering Research Centre of the Faculty of Sciences of the University of Lisbon (FCUL).
Data compiled
Other formats
Executive Summary
Under DL No. 83/2018, of October 19, which establishes the accessibility requirements for websites and mobile applications, the Agência para a Modernização Administrativa, I.P. (AMA), is responsible for presenting a report to the European Commission every three years on the monitoring results, including measurement data. This document contains the results and measurement data for the 2nd monitoring period, spanning 2022 to 2024.
For the analysis during this monitoring period, a sample of 657 websites and 33 mobile applications was selected, following the methodology proposed by Implementing Decision (EU) 2018/1524. Websites underwent two types of monitoring: simplified monitoring, which mainly involves running an automatic validator through a sample of pages, and in-depth monitoring, involving manual validation by an accessibility expert. Mobile applications were only subject to in-depth monitoring.
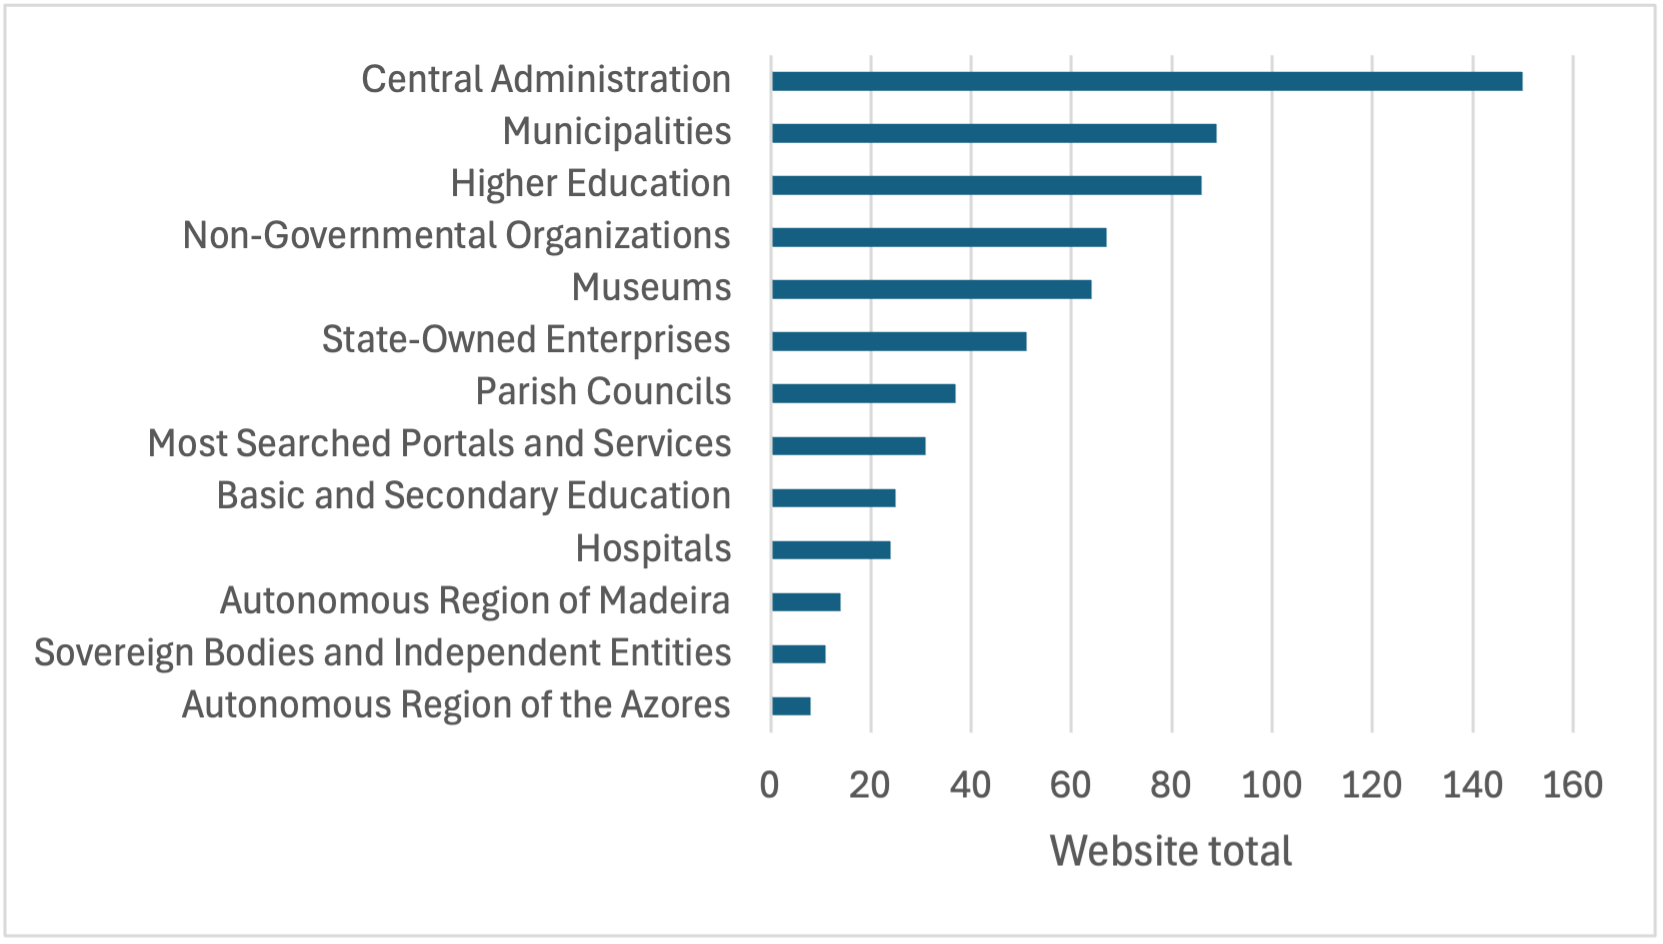
When selecting the sample of websites, geographical criteria (central, regional, and local) as well as type of service, demand, and sector of activity were considered. Both the website and mobile application samples were submitted for review to organizations representing people with disabilities through the Inclusion Policy Committee coordinated by the Secretary of State for the Inclusion of Persons with Disabilities.
Note: if you are unable to consult the following chart for any reason, see the data in Table 1.
Websites
In the present analysis, we used a simplified monitoring approach with a sample consisting of the first page and all pages hyperlinked from the first page within the domain, which we designated as H+. Using the H+ methodology to collect pages across all websites, we obtained an average sample of 61 pages per website. For in-depth monitoring, we selected a subset of websites from the simplified monitoring process, totaling 54 out of 657 websites. A total of 424 pages from these 54 websites were manually evaluated.
Note: if you are unable to consult the following chart for any reason, see the data in Table 17.
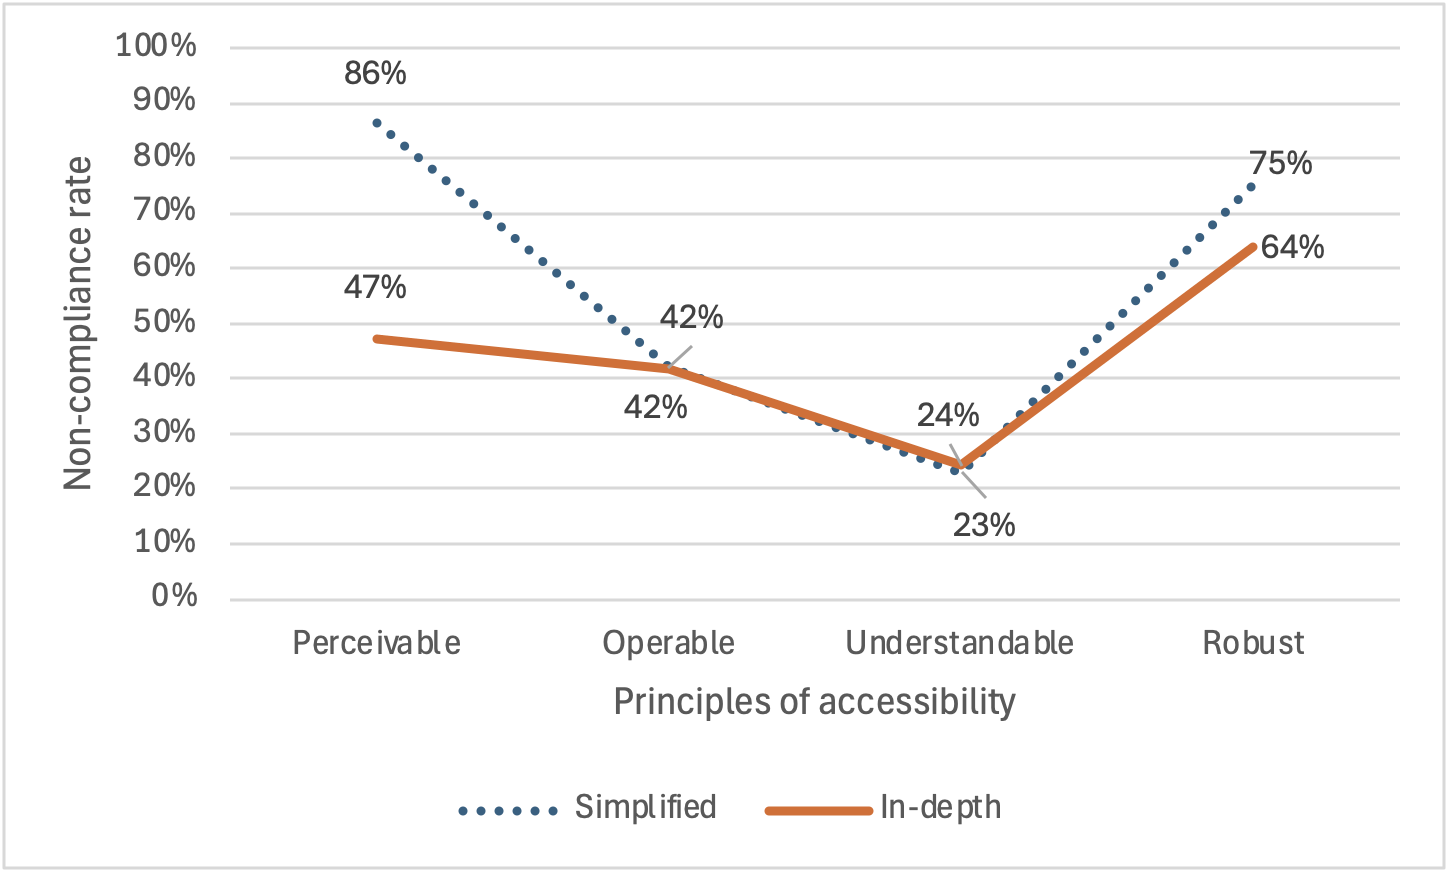
In Graph 2, the average non-compliance rate for all websites is presented for each principle, covering all the clauses of that principle. It can be observed that the two methodologies yield similar, and even identical, results for three of the principles—namely, Operable, Understandable, and Robust. The only exception is the Perceivable principle, where the difference between the results of the two methodologies is significant—approximately 40 percentage points. For this principle, as well as for the others, the simplified methodology always results in equal or higher non-compliance rates.
The simplified methodology, being based on an automated evaluation tool, assesses a significantly smaller number of requirements – 13 for the simplified methodology vs. 56 for the in-depth methodology. For three principles, the simplified methodology approximates the results of the more reliable in-depth methodology. For the Perceivable principle, the three requirements assessed by the simplified methodology present a more negative picture, with high non-compliance rates. According to the in-depth methodology, those three requirements have a 100% non-compliance rate, even higher than the 86% reported by the simplified methodology.
Mobile Applications
The mobile application sample included 16 applications from various public entities in their iOS and Android versions (32 applications), plus one Android-only application, resulting in a total of 33 mobile applications analyzed. The average non-compliance rate for all requirements was 22% for iOS applications and 24% for Android applications, showing no clear advantage for either platform.
Note: if you are unable to consult the following chart for any reason, see the data in Table 18.
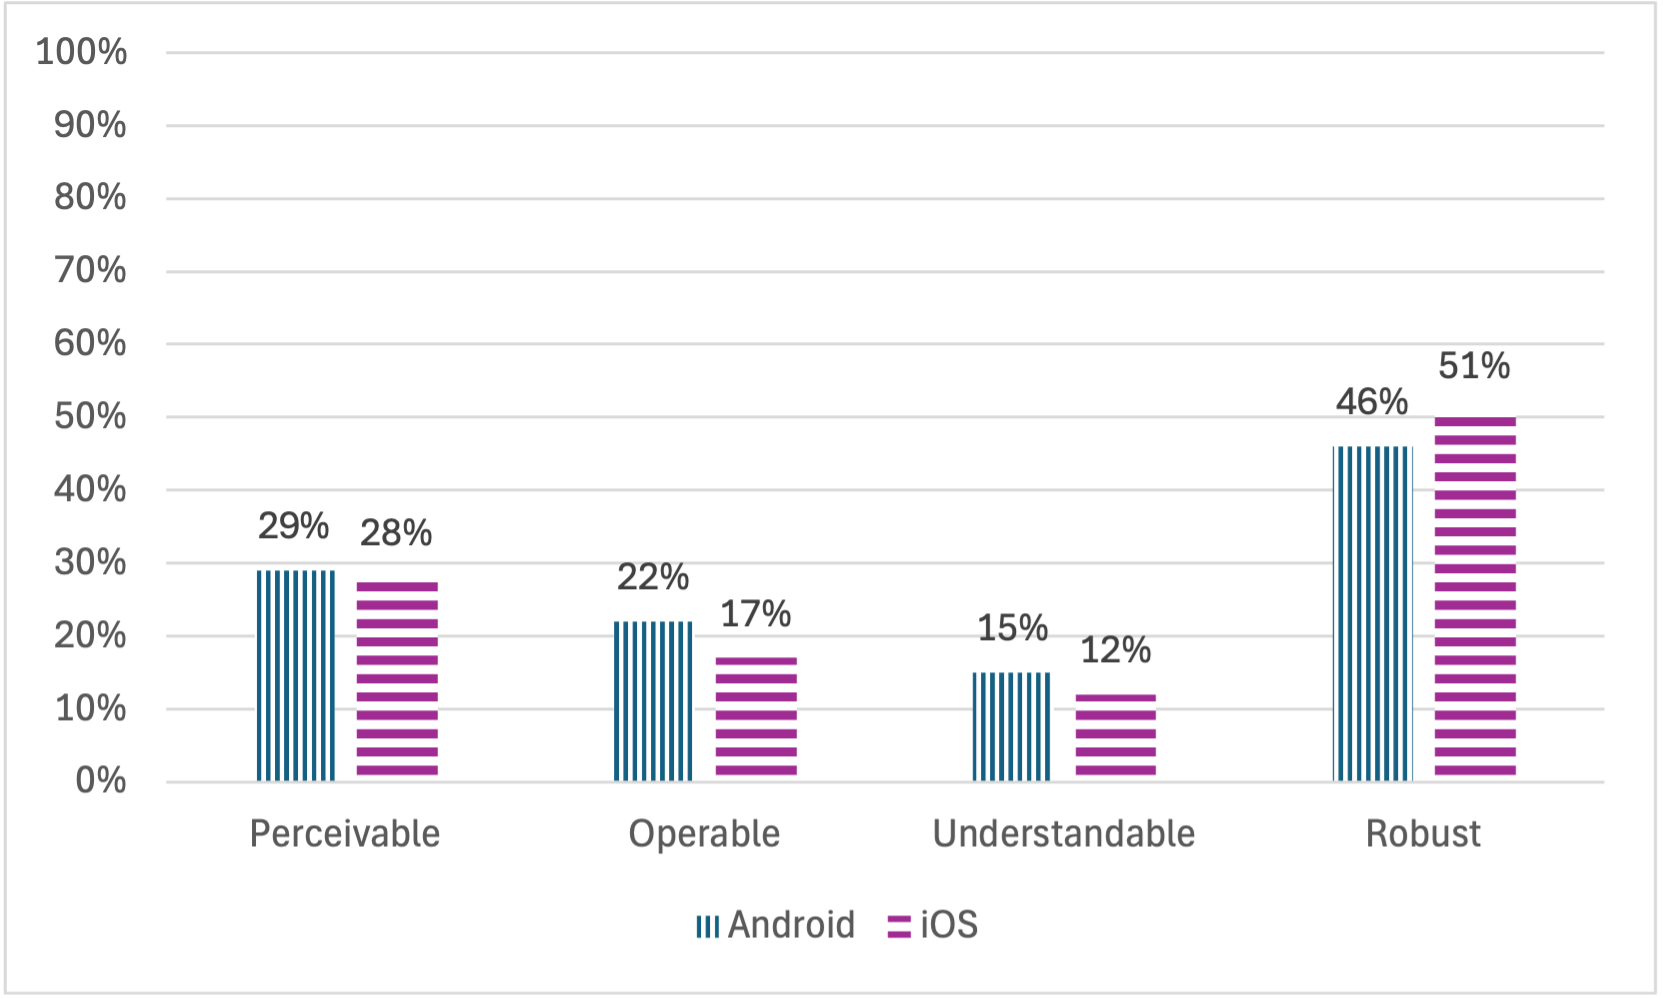
In Graph 3, the average non-compliance rates for all requirements, grouped by principle, are compared. Differences between the two operating systems are minor. iOS applications demonstrated higher compliance with the Perceivable, Operable, and Understandable principles, while Android applications performed better under the Robust principle.
Websites and Apps
Note: if you are unable to consult the following chart for any reason, see the data in Table 19.
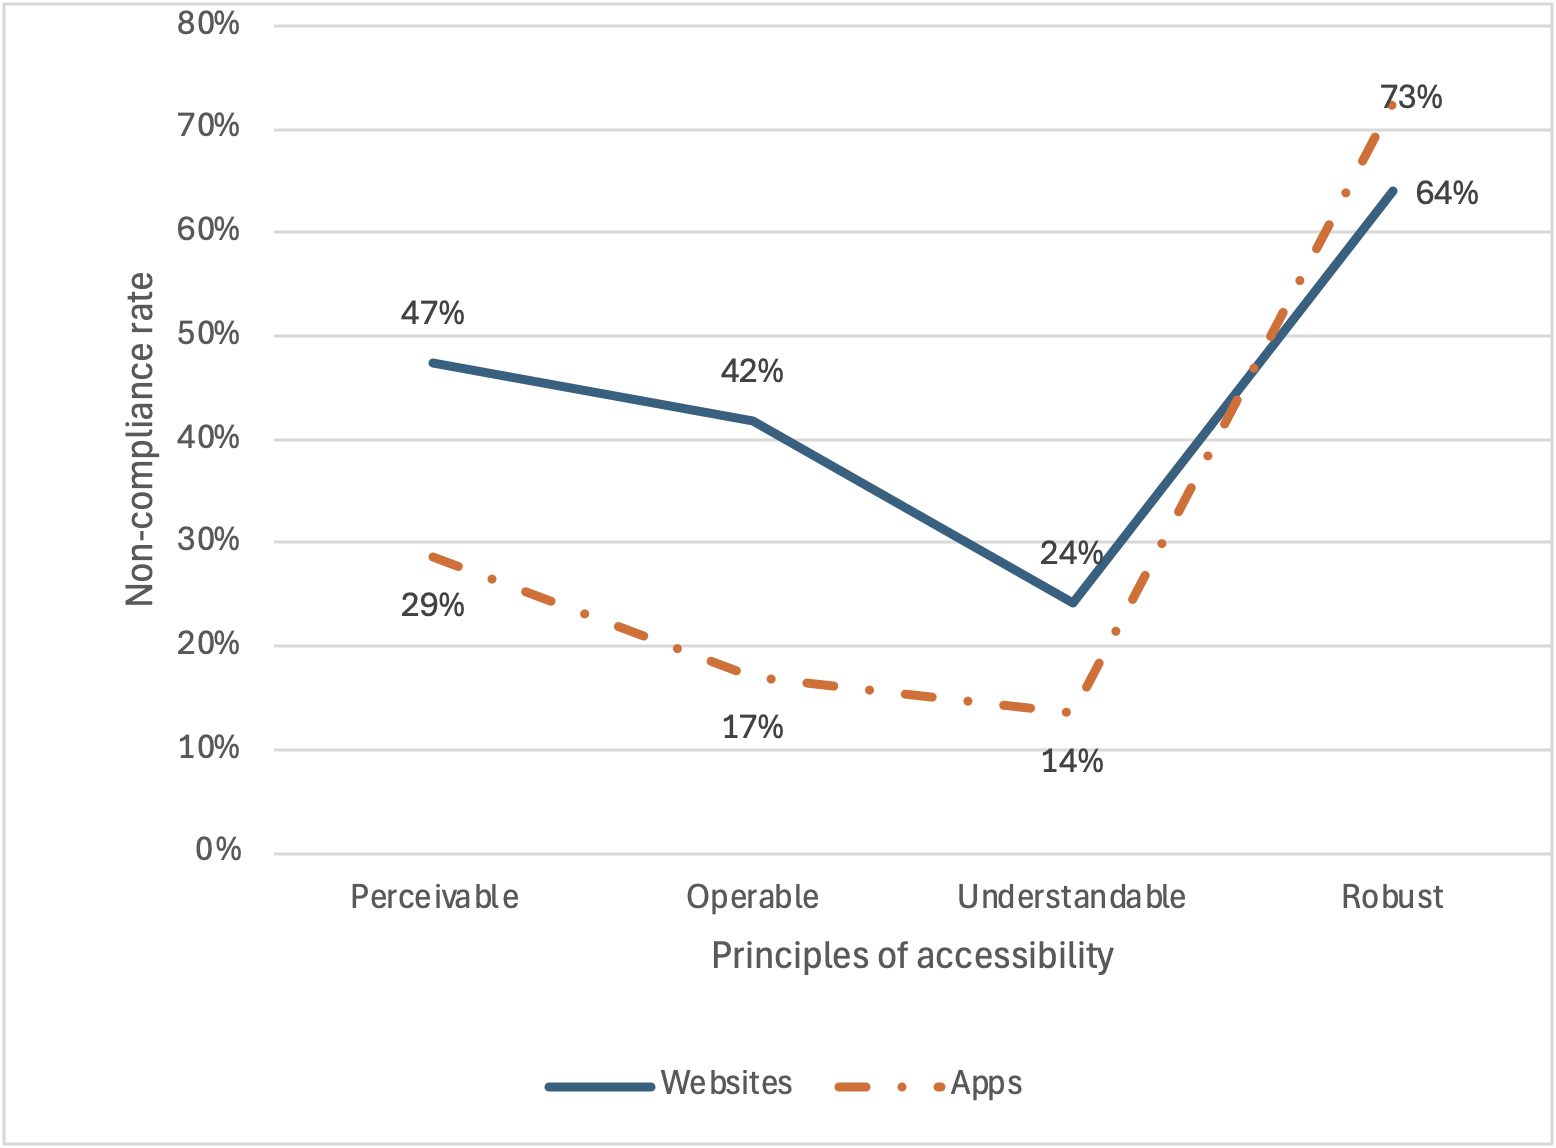
In Graph 4, the performance of websites and mobile applications across the four accessibility principles is compared. The same trends affect both websites and mobile applications—the best and worst principles coincide. However, mobile applications consistently perform better than websites, except for the Robust accessibility principle.
In fact, for mobile applications, this is the principle that saw the greatest decline from the 1st to the 2nd monitoring report. In the 2024 report, the Robust principle for both websites and mobile applications shows non-compliance rates between 60% and 70%, with mobile apps surpassing website compliance levels for the first time.
At the root of this non-compliance are issues related to the correct handling of element semantics—buttons that function as links, links presented as buttons, and interactive elements that appear as simple text. These problems leave, for example, screen reader users unaware of how to interact with such elements.
Users and Main Issues
Which users face the most barriers? The European Norm EN 301 549 establishes a link between accessibility requirements and the users who benefit from these practices, referred to as Functional Performance Statements. These statements encompass not only people with disabilities but anyone facing temporary or situational limitations, such as difficulty using a smartphone in bright sunlight.
Note: if you are unable to consult the following chart for any reason, see the data in Table 20.
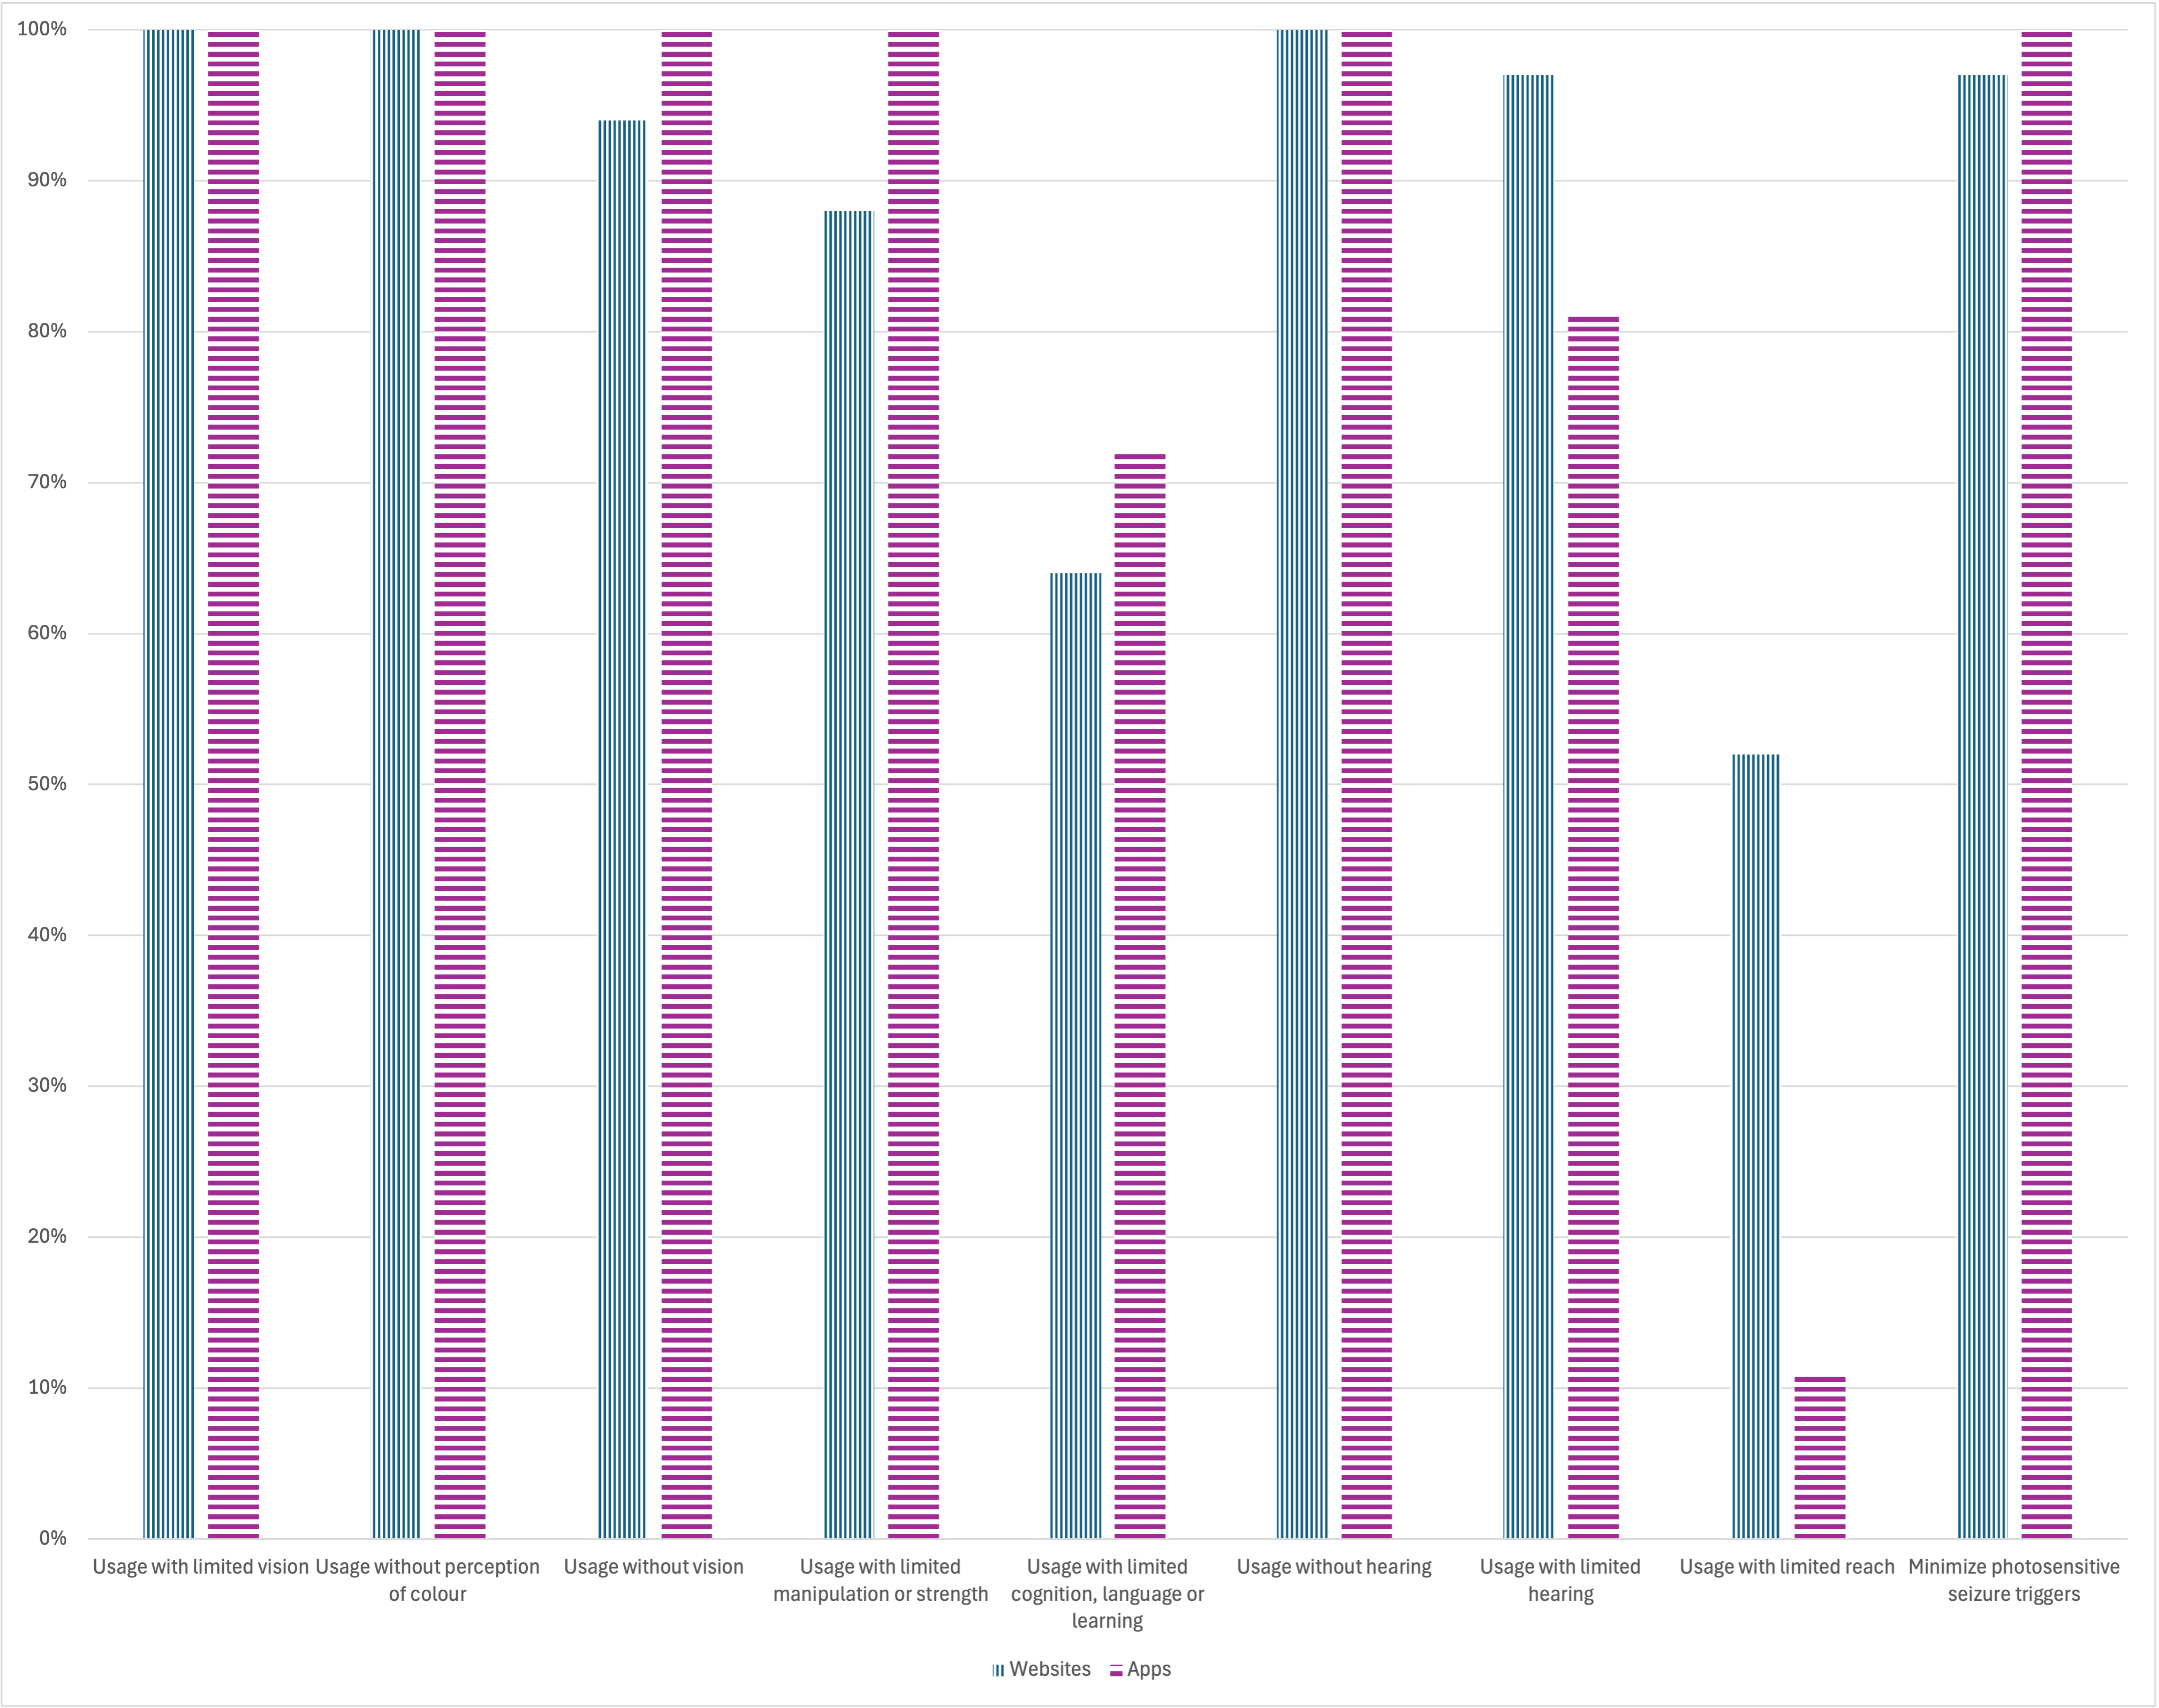
The data collected (Graph 5) indicates that nearly all websites and mobile applications have non-compliances across almost all Functional Performance Statements. The only exceptions are for the statement “Use with limited reach,” where 52% of websites and 11% of mobile applications are non-compliant, and “Use with limited cognition, language or learning,” where 64% of websites and 72% of mobile applications are non-compliant. For all other statements, non-compliance exceeds 80%, with rates above 90% for five statements.
Comparison with the Previous Monitoring Period
As this report concerns the second monitoring period, comparing its results with those of the first period helps identify trends in the accessibility of public websites and mobile applications in Portugal.
Note: if you are unable to consult the following chart for any reason, see the data by requirement in Table 12.

Graph 6 compares non-compliance rates for websites, grouped by accessibility principle. The values, derived from requirements assessed in both periods, show minor differences from earlier graphs. The accessibility level of websites has not improved over this period. Non-compliance for the Perceivable principle decreased from 52% to 47%. For the Operable principle, it increased from 40% to 42%. For the Understandable principle, it rose from 22% to 24%. For the Robust principle, it dropped from 72% to 64%. Calculating the average non-compliance rates for the four principles reveals a positive evolution, with the non-compliance rate decreasing from 46.5% in the first period to 45% in the second period. However, when comparing the average non-compliance rate for all clauses (without grouping by principle), it is observable that the value remained exactly the same, at 43%.
Note: if you are unable to consult the following chart for any reason, see the data by requirement in Table 16.

Graph 7 compares non-compliance rates for mobile applications, grouped by accessibility principle. As with websites, these values reflect requirements assessed in both periods and may slightly differ from earlier graphs. The accessibility level of mobile applications also showed no improvement. Non-compliance for the Perceivable principle remained at 30%. For the Operable principle, it decreased from 21% to 17%. For the Understandable principle, it increased from 13% to 14%. For the Robust principle, it rose from 44% to 73%. In fact, for mobile applications, this is the principle that saw the greatest decline from the 1st to the 2nd monitoring report. Calculating the average non-compliance rates for the four principles reveals that, for mobile applications, there was a negative evolution, with the non-compliance rate increasing from 27% in the first period to 33.5% in the second period. However, when comparing the average non-compliance rate for all clauses (without grouping by principle), the situation for mobile applications mirrors that of websites, as the average non-compliance rate remained exactly the same, at 25%.
Acessibilidade Web
Na UE o standard que contém os requisitos de acessibilidade aplicados à Web e às aplicações móveis é a Norma EN301549. Ela não é mais do que uma cópia do standard WCAG 2.1 conformidade ‘AA’. Em Portugal esses requisitos constam do RNID conforme decretado pelo DL n.º 83/2018.
O validador de práticas de acessibilidade web (WCAG 2.0)
Partilhar